Problems with system comparisons
When you publish a paper on a new imaging system, people often want to compare figures of merit. Field-of-view, resolution, speed, etc. They want to know in what ways your system is better than other systems. Don’t take them at face value. They nearly always lack the rigor required to make the comparisons they present.
This paper (free pubmed pdf), with an excellent team led by Adam Packer, is the best resource to date for spec’ing a multiphoton imaging system. It’s less than a year old, and it should hold up over time fairly well.

There is a lot of good information in the paper– lots of technical details that are often omitted from methods sections. Check it out. Field-of-view, uniformity, resolution, sensitivity, and more.
The main problem is that the authors aren’t making the measurements of other systems. They’re just trying to glean specifications from papers. The numbers are almost never measured the same way, and often times aren’t even measured at all. So the authors just try to pull what they can from the papers. And of course, the authors are biased, so they will make judgement calls in favor of their system and against others.
Here are some examples:
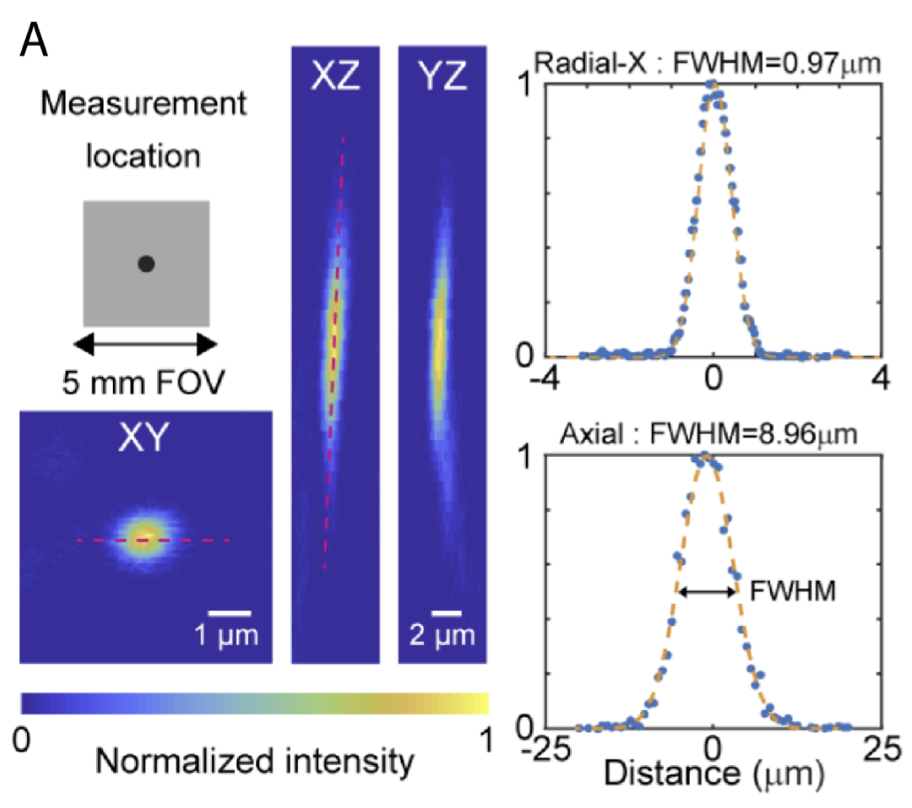
Resolution / point spread function (PSFs): If you’re unfamiliar with PSFs, see the section on spatial resolution here. The process for measuring PSFs isn’t always the same lab-to-lab. One thing I’ve seen is measuring PSFs that are tilted in the XZ or YZ planes with just a straight vertical line, which underestimates the full PSF extent. Look at the PSF graph at the top of this page. If you draw a vertical line in the YZ projection (right) that crosses through the maximum, you’ll get a smaller number than you do if you take the XZ projection and use a tilted line that captures more of the extent of the PSF. There are a bunch of different ways to measure PSFs. Some people will investigate and redo the measurement if it comes out bigger than they expect, but will just declare victory and move on if it is smaller than they expect. Thus, due to differences in process, it can be hard to compare small differences in PSFs across labs.
Depth: I’ve seen comparisons on imaging depth for multiphoton systems. However, almost no one makes rigorous measurements on imaging depth. They just take some images at a particular depth and that’s it. The comparisons are completely meaningless. The quality of images at depth are massively dependent on staining: brighter and sparser staining will make it easier to image deeper. Staining quality is by far the biggest determinate on how multiphoton images will look at depth. There is relatively little engineering that you can do to improve imaging at depth. There is a benefit to avoiding very high NA excitation in deep multiphoton imaging, which I discussed here. But for two systems that have similar NA, the performance is expected to be nearly indistinguishable. Higher collection NA should help, but even that is unclear, as the marginal rays don’t contribute to the overall signal as much as one might hope. “Most high angle skew rays entering the objective are simply lost in the barrel of the lens and never pass through the OBA [objective back aperture].”
So what these depth imaging comparisons are really doing is just comparing anecdotes between papers, which is meaningless. In our Trepan2p paper, we presented a video where we imaged down to 824 microns in vivo to see layer 5 cells. That was in a bright and sparsely labeled thy1 line which we had handy at the time. The Diesel2p system has higher NA, higher resolution, and is better in a ton of ways, but we didn’t present any data imaging deeper than 500 microns. Not because we couldn’t, but just because we didn’t have a preparation to image that was nice for that kind of imaging. A foolish comparisons of anecdotes would imply that the Trepan2p can image deeper than the Diesel2p, and that is wrong. Don’t fall for comparisons that are wrong. Look for rigorous assessments.
Imaging speed: Again, authors often use anecdotes for comparisons rather than rigorous measurements. They take some example imaging from one paper, field-of-view and frame rate, and then compare it to some example imaging from another paper. This is meaningless. They’re just comparing presented anecdotes. It’s easy to image fast over a large field of view and get useless data. It’s foolish to compare that low quality imaging mode to another paper where the authors zoomed in to have a lot of samples per neuron and get high fidelity measurements of fluorescence changes and carefully subtracted out the neuropil signals. Really, what people could compare is scan speed across systems with similar NA. For example, take two resonant scanning systems. Take the frequency of the resonant scanner, double it for bidirectional scanning, and then multiply it by the width of the resonant scan line. That’s a quantitative measurement that is actually pretty easy to take. It just requires a careful measurement of the width of the resonant scan line. And to be fair, it should be considered along with the excitation NA / resolution of the system.
Addendum: When reviewing a bunch of papers, it’s nice to focus on the figures of merit the papers were focused on. For example, the numbers that show up in the abstract, or were definitely a landmark and the authors had pushed for. Also, it’s good to cite prior work to highlight what’s new in a paper. But it is bad practice to undersell prior work. Once authors are trying to plot a bunch of prior work on 3 or more dimensions, they’re going to be making a lot of apples-to-oranges comparisons.