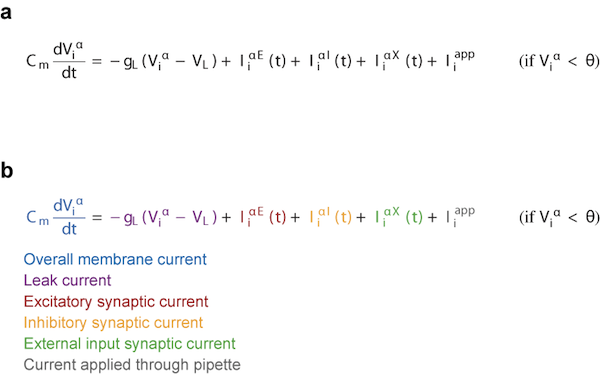
Color-code terms in equations
Posted in Tips
This is such a simple and powerful trick, I don’t know why I hardly ever see it used. When giving an equation during a talk or in a paper, typically that equation is best understood as a series of terms. Those in your audience who are familiar with the terms, like yourself, will instantly recognize them. However, some of your audience won’t. These people can be helped by a simple color coding scheme. Let me demonstrate:
The color coding saves space and quickly gives an intuitive feel for how the terms should be considered. This “legend” can also be a quick way to give ranges for values used in models. Of course, this isn’t something terribly new, but it should be done more. (equation from Renart et al. 2010)

Another example:
http://blog.revolutionanalytics.com/2014/01/the-fourier-transform-explained-in-one-sentence.html
Bonus: click through the second figure in the blog post, the one with the graphs, to get to browser-based IDE for Processing with the functions running. You can edit the code with the pullout to the left and see the changes immediately (click unlock to edit code, and restart to see the changes).