Two-Photon Cross Sections
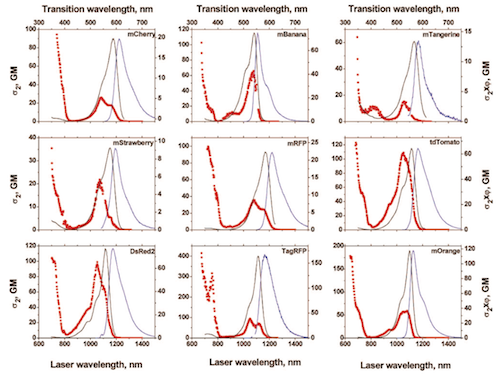
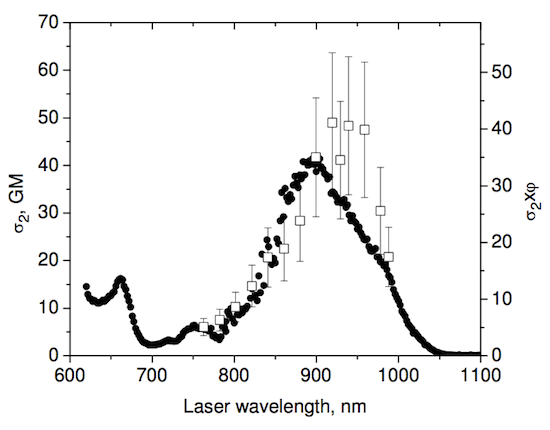
It’s difficult to track down 2p absorption cross sections for dyes and proteins. Doing it right requires (ideally) fluorescence lifetime imaging and Strickler-Berg analysis. Here’s an example, measuring the 2p absorbance cross sections for orange and red fluorescent proteins: Drobizhev et al. 2009.
However, most people just aren’t set up for that. Many labs will make comparison measurements for their own reference, just plotting brightness versus excitation wavelength for a fixed average power (we’re biomedical scientists, not spectroscopists after all). This is useful, but not publishable, and thus not shared. So everyone ends up doing it themselves, effectively wasting a bunch of time.
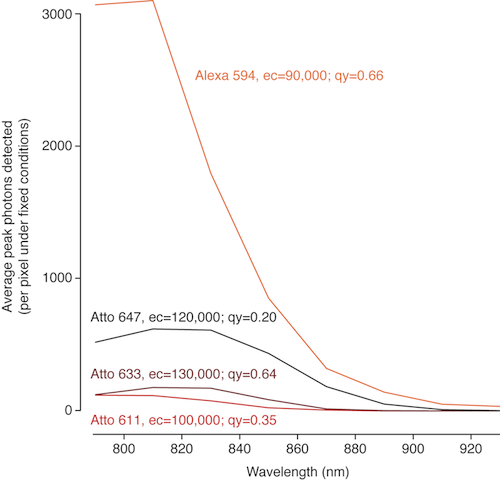
Just the other day I checked out a few far red dyes (Atto 647, Atto 633, and Atto 611) and didn’t find them useful for 2p microscopy. Instead of keeping this to myself and letting everyone else figure out for themselves that they aren’t useful for 2p, let me save you the time.
Alexa 594 was my baseline. It’s a nice bright red dye– the broad side of a barn, in terms of 2p cross section. Unfortunately, the far red Atto dyes I compared it to were very dim. Here’s the graph. Next to their names, I’ve written the quantum yield (qy) and extinction coefficient (ec) for each dye (1p fluorescence measurements, from the manufacturer).
Normal fluorescence spectra
By the way, 1p spectra are all over the place. Here are some handy links:
Invitrogen’s Spectra Viewer
BD Biosciences’ Spectra Viewer
Boswell & McNamara’s Spectra Viewer
Pubspectra (link) (link)


Thanks for the spectra. Do you have any information about the 2P spectrum of Alexa 594 between 700 and 800 nm.
Hi Steve-
It falls off fairly quickly at wavelengths shorter than 775nm, but it’s still probably usable down to 700nm. You can see a bit of the in the following post: http://labrigger.com/blog/2010/10/22/more-2p-cross-sections/
Thanks for doing this. Certainly useful. It’s unfortunate that you didn’t take the time to do the experiment in such a way that you can publish it. Posting in forums may save you some time in the short term, but means that someone else will have to do the experiment again in order to make your results “scientific.”
[x] done (not by me). Finally also including GCamP3 and some more synthetic Ca2+ indicators.
http://www.ncbi.nlm.nih.gov/pubmed/22385865
[…] 2p cross sections More 2p cross […]
SETA BioMedicals offers bright, red emitting fluorescent labels with very high two-photon absorption cross sections up to 900 nm: www. setabiomedicals.com
[…] George McNamara is planning on updating the massive PubSpectra (previously mentioned here). […]
[…] uses George McNamara’s Pubspectra database. […]
The link for the Strickler-Berg analysis paper is broken
The link is fixed now. Thanks for letting me know.
[…] Prior posts on 2p cross sections: […]
Did any of you compare brightness between Texas Red and Alexa 594 under 2P excitation?
I realize this isn’t the answer to your exact question, but I hope it is useful to what you are trying to achieve: Not with Texas Red, but I compared Alexa 594 and Atto 594. The latter is much brighter.
11 years late to the game on this but it is not the case that Alexa 633 is dim or useless for 2-photon microscopy. In 2012 we published a Nature Methods paper (Shen et al.) showing it selectively labels artery walls in vivo (and ex vivo) and is super-bright compared to Alexa 594. My bet regarding why you saw very few photons detected was your optics design (primary dichroic and PMT filters). After we published our paper, I would often get emails of someone saying, they don’t see Alexa 633 labeling and always the reason was that the standard primary dichroic and PMT filters were not red-shifted.
Thanks for the comment. I agree that Alexa 633 is useful for 2p imaging, as you have shown (and others have replicated). The plot here is for Atto 633, not Alexa 633. They are similar, but not identical. For example, the molar extinction coefficient for Alexa 633 is higher (159k cm^-1 /M^-1) than that for Atto 633 (130k). 2p cross sections are likely different as well. Do you know a reference where they were measured?