Visual stimuli for mice

By virtue of their small eyes, mice enjoy a large depth of field. In a classic experiment (buried in the methods section) Balkema and Pinto put +6, 0, and -7 diopter lenses in front of mouse eyes and measured no change in retinal ganglion cell receptive field sizes. Clearly there isn’t much of a need for accomodation with such depth of field, and indeed, an attempt to stain for ciliary accomodation muscles in mouse eyes came up with zip (ref). Therefore, visual stimuli can be placed over a large range of distances in front of mice and remain in focus.
Since everything is in focus, it’s possible to place a visual stimulus monitor right in front of a mouse and cover a large amount of visual space. However, since the monitor is flat rather than spherical, the image will appear distorted from the mouse’s point of view. For example, a circle with a 100-pixel diameter in the middle of the screen will look larger and more circular than a 100-pixel diameter circle at the top left of the screen.
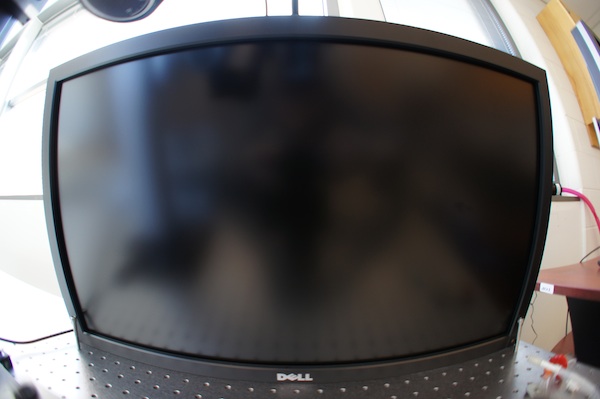
It’s related to a simple fisheye lens distortion, like the photograph above, but a bit more complex since the monitor is tilted towards the animal. So we can’t apply a simple pincushion distortion (which is the inverse of a fisheye distortion) to correct for it. I’ve found that a straightforward approach is to simply model the monitor. At first, I thought this would be rather inelegant, but in practice, it’s very simple.
Here I offer some MATLAB code that applies a corrective distortion to visual stimuli to cancel out the distortion caused by using a flat monitor to cover a large range of visual angle. With this code, you can treat the X-Y coordinates of a source image as angles of azimuth and elevation. The corrective distortion will change the image so that horizontal lines are mapped to isoelevation lines and vertical lines are mapped to isoazimuth lines.
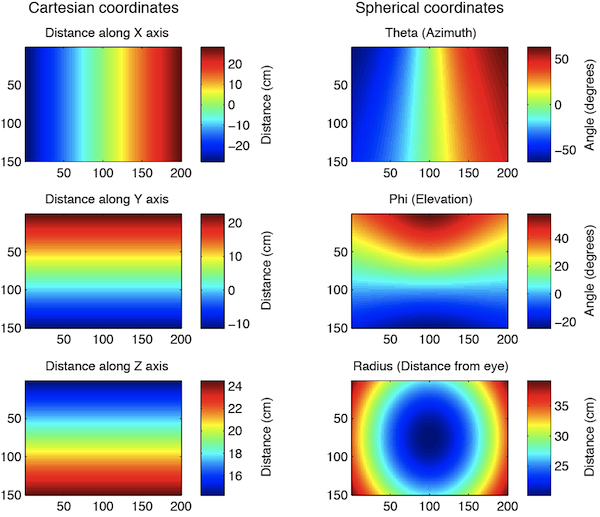
Step one is to generate a 3D model of the monitor using some measurements that are easy to take. In the image below, on the left we have mapped pixel locations on the monitor in Cartesian coordinates relative to the mouse’s eye. On the right, we have re-mapped these to spherical coordinates. Using this data, we will generate an interpolation that applies the distortion.

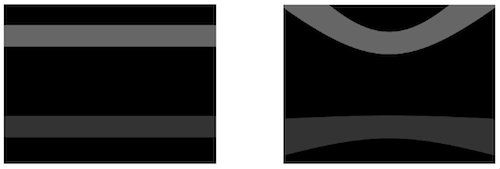
Step two is to apply the distortion using interpolation. Here are a couple of example corrective distortions. On the left is the source image, on the right is the image after the corrective distortion. The curved lines will look straight from the mouse’s point of view.


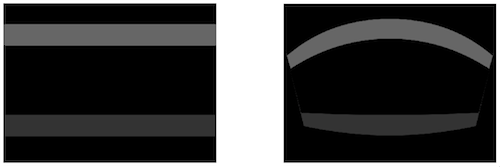
By the way, using similar code, you can check and see how the visual stimuli would appear to the mouse if it went uncorrected. Here are a couple of examples.


More Labrigger posts on visual stimuli
Click through to get the MATLAB code….
This code will map the monitor coordinates into spherical coordinates from the mouse’s point of view. You can modify it with your own measurements.
clear all

% Monitor size and position variables
w = 56.69;  % width of screen, in cm
h = 34.29;  % height of screen, in cm
cx = w/2;   % eye x location, in cm
cy = 11.42; % eye y location, in cm

% Distance to bottom of screen, along the horizontal eye line
zdistBottom = 24.49;     % in cm
zdistTop    = 14.18;     % in cm

% Alternatively, you can specify the angle of the screen
%screenAngle = 72.5;   % in degrees, measured from table surface in front of screen to plane of screen
%zdistTop = zdistBottom - (h*sin(deg2rad(90-screenAngle)));

pxXmax = 200; % number of pixels in an image that fills the whole screen, x
pxYmax = 150; % number of pixels in an image that fills the whole screen, y

% Internal conversions
top = h-cy;
bottom = -cy;
right = cx;
left = cx - w;

% Convert Cartesian to spherical coord
% In image space, x and y are width and height of monitor and z is the
% distance from the eye. I want Theta to correspond to azimuth and Phi to
% correspond to elevation, but these are measured from the x-axis and x-y
% plane, respectively. So I need to exchange the axes this way, prior to
% converting to spherical coordinates:
% orig (image) -> for conversion to spherical coords
% Z -> X
% X -> Y
% Y -> Z

[xi,yi] = meshgrid(1:pxXmax,1:pxYmax);
cart_pointsX = left + (w/pxXmax).*xi;
cart_pointsY = top - (h/pxYmax).*yi;
cart_pointsZ = zdistTop + ((zdistBottom-zdistTop)/pxYmax).*yi;
[sphr_pointsTh sphr_pointsPh sphr_pointsR] ...
            = cart2sph(cart_pointsZ,cart_pointsX,cart_pointsY);

% view results
figure
subplot(3,2,1)
imagesc(cart_pointsX)
colorbar
title('image/cart coords, x')
subplot(3,2,3)
imagesc(cart_pointsY)
colorbar
title('image/cart coords, y')
subplot(3,2,5)
imagesc(cart_pointsZ)
colorbar
title('image/cart coords, z')

subplot(3,2,2)
imagesc(rad2deg(sphr_pointsTh))
colorbar
title('mouse/sph coords, theta')
subplot(3,2,4)
imagesc(rad2deg(sphr_pointsPh))
colorbar
title('mouse/sph coords, phi')
subplot(3,2,6)
imagesc(sphr_pointsR)
colorbar
title('mouse/sph coords, radius')
And here’s the code to try the distortion out.
%% try a distortion

% make source image
checkSize = 5; % pixels per side of each check
w = 100; % width, in pixels
h = 75; % height, in pixels
I = double(checkerboard(checkSize,round(h/checkSize),round(w/checkSize))>0.5);

% alternate source image
%I = zeros(150*4,200*4);
%I(105*4:125*4,:)=0.2;
%I(20*4:40*4,:)=0.4;

% Rescale the Cartesian maps into dimensions of radians
xmaxRad = max(sphr_pointsTh(:));
ymaxRad = max(sphr_pointsPh(:));

fx = xmaxRad/max(cart_pointsX(:));
fy = ymaxRad/max(cart_pointsY(:));

% Apply the distortion via interpolation
ZI = interp2(cart_pointsX.*fx,cart_pointsY.*fy,I,sphr_pointsTh,sphr_pointsPh);

h=figure;
subplot(1,2,1)
imshow(I)
subplot(1,2,2)
imshow(ZI)
Here’s the line of code to use for the reverse transformation. To see what the visual stimulus would look like from the mouse’s point-of-view (MPOV) if it were not corrected.
ZI_origMPOV = griddata(sphr_pointsTh,sphr_pointsPh,I,cart_pointsX.*fx,cart_pointsY.*fy);
You’re right when you say “a circle with a 100-pixel diameter in the middle of the screen will look larger and more circular than a 100-pixel diameter circle at the top left of the screen,” but on the other hand “The curved lines will look straight from the mouse’s point of view” is wrong. Lines that are physically straight look straight, and “look straight” to us even though our retinas are curved. Isoelevation contours on the other hand are not straight lines and do not look like straight lines.
Right. What I said wasn’t completely correct. Isoazimuth or isoelevation lines do not necessarily “look straight”. Point taken.
That said, I do want to add one bit of self-experimentation I tried. I viewed corrected and uncorrected square wave gratings from the mouse’s point of view: one eyeball, same point in space, fixating at the center of the screen and paying attention to how the edges of the screen looked. Uncorrected gratings appeared to lie in the plane of the screen, which was tilted towards me. Corrected gratings appeared to be straight up and down, perpendicular to the table. So at least in that specific case, curved lines appeared “straight”.
I should reference Marshel, Garrett, Nauhaus & Callaway’s 2011 Neuron paper. In the supplement, they go into great detail regarding how they distorted visual stimuli to activate isoelevation and isoazimuth lines in the visual field of a mouse (in the supplemental section titled “Spherical Stimulus Correction).
I wrote this entry prior to noticing this section in that paper, but I want to mention it here not only because they reported it first, but also because it’s a very nice write up. They used a giant monitor (68 x 121 cm, that’s about a 54” diagonal screen, to compare it to consumer TVs) and placed it 10 cm from the mouse’s eye. This allowed them to cover basically all of the visual hemifield.
And for citing the code posted here? (which is extremely appreciated, by the way)
I’m glad it’s useful. Any kind of citation is appreciated. Journals often have some way to cite web pages.