Variability where you really don’t want it
Post by Christian Wilms
I’ll admit it: I’m lazy. When I use a calcium indicator and need to know its physico-chemical properties, I like to simply look it up in the manufacturer’s catalogue or website. Of course I don’t expect those values to be perfect, but close enough for most purposes. Turns out that isn’t the way things are.
While looking into using a dextran conjugate of OGB-1 some time ago I stumbled over the first problem: depending on where on the Invitrogen website one looks, you find two different K_d values: 165 nM and 265 nM. Different, but still both clearly “high affinity”. Things got a little more complicated when I received the indicator and discovered that the K_d specified on the vial was 1180 nM — not really high affinity. Running a calibration experiment revealed more: instead of a single K_d, the indicator appeared to have 2, one medium affinity around 300 nM and one low affinity at well over 1000 nM. Another thing I noticed was the dynamic range of the indicator was reduced from 14-fold for the free salt form to just above 5-fold for the dextran conjugate, which also wasn’t specified in the documentation. I have since then found that these values differ from batch to batch. All of this applies to dextran conjugates of other indicators as well.
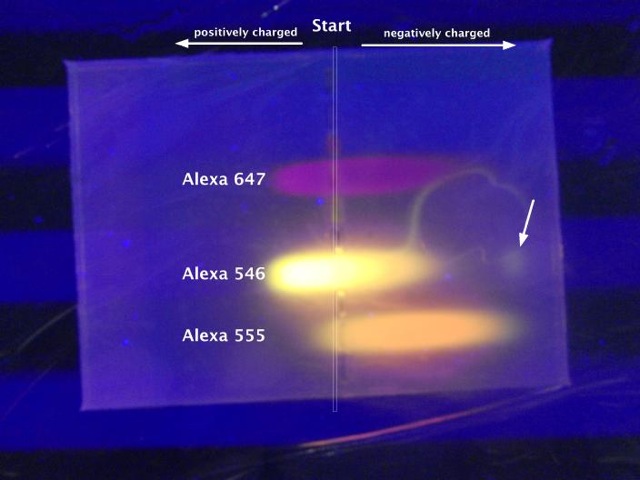
Similarly, “anionic” fluorescent dextran conjugates aren’t always negatively charged. Running a selection of three different Alexa-Fluor conjugates on an electrophoresis gel reveals that they are all mixtures (which is not surprising) and in some cases the cationic forms dominate (which *is* surprising; e.g. Alexa-546 in picture).
More worrying, as it applies to the free salt form of a calcium indicator, was an observation mentioned in a recent publication by Faas and Mody:
“We have to make an extremely important note of caution here: over the past 8 years, we have determined the properties of each individual factory batch of OGB-5N we used, and found that their properties vary considerably (see Table 1). Although the properties within a batch are very stable, we found that between batches the Kd varied from 34 to 46 ?M and the Fratio (Fmax/Fmin) varied from 10 to 40.”
(Faas & Mody; BBA-General Subjects, 1820(80): 1195–1204)
While the variability in itself is unpleasant, what I find to be really problematic is that these things appears to be ignored by suppliers and researchers need to work them out for themselves. At the very least one would expect catalogues to specify ranges for both K_ds and gain factors. Ideally, the correct values for the current batch should also be specified. Until then: if it’s even mildly important, don’t trust the specs.
I hate to say it, but we have seen similar problems with Invitrogen’s products. We routinely use fluorescent dextrans to label nerve projections by applying the lyophilized crystals to a cut nerve end. Before Molecular Probes was bought by Invitrogen most batches that we used worked quite well, and when there was a problem they were quick to help us resolve it. However, now very few batches work for this purpose and the quality of the resulting label varies considerably between batches. We haven’t analyzed the properties of individual lot numbers as our lab is not equipped to do so, but our suspicion is large variability in molecular weights causing differing amount of transport. Tech support gives no suggestions as to why this is the case other than that we are using the product in an unusual way. Needless to say, when we find a particular batch that works well, we purchase the tracer in bulk and ration it carefully. Then when the supply runs low we hope that we can find another batch to work. There are definitely some quality control issues with some of these larger companies, and it is buyer beware.