Calcium imaging analysis GUI for MATLAB
Stephan (currently in the Gilbert lab @ Rockefeller) wrote in to share his code for analyzing calcium signalling data in MATLAB. Thanks, Stephan!
Stephan writes…
I made a MATLAB GUI that automatically extracts ROIs from calcium imaging data. You can also add behavior data. Take a look if you feel like, try it out and of course feedback is always welcome.
https://github.com/ninehundred1/CalciumSignalExtract
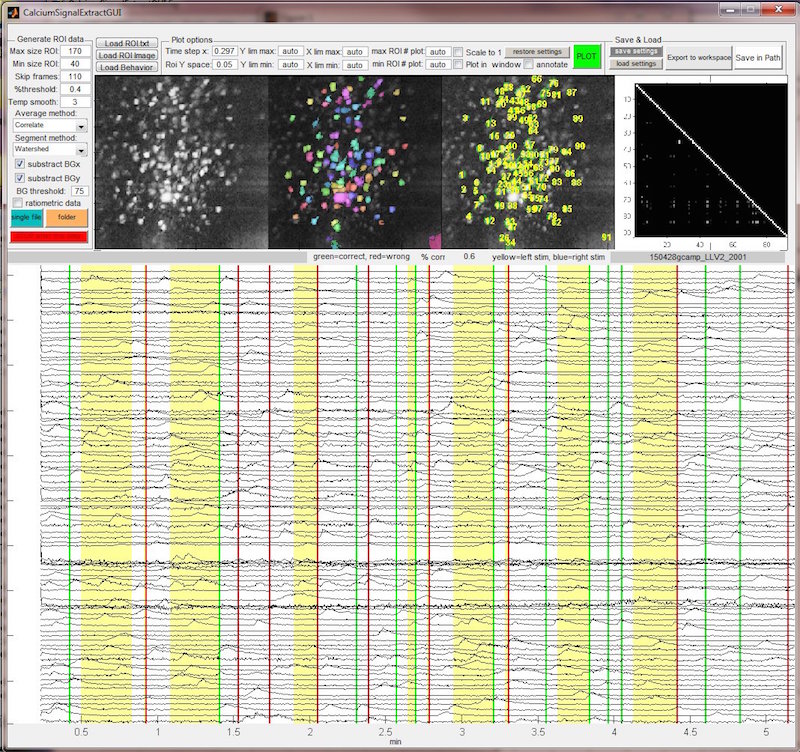
Summary
A MATLAB GUI that automatically segments fluorescence image stacks into ROIs based on differential morphology and fluorescence activity of the individual cells. The time course data of each ROI gets extracted and plotted.
Different parameters can be set to match the nature of the data in terms of signal strength, expected size of cells and the kind of fluorescent probe (single flourophore vs ratiometric). Concurrently acquired data from behavioral apparatus and sensory stimuli can be integrated to analyze the imaging data for task and stimulus dependent neuronal events.
One way to average the stack before segmentation is based on this Labrigger post, so somewhat it goes back to the community…
Thanks for posting this code Stepen! We currently do have a code that we are using for ROI selection and eventual analysis. Our current road block is motion correcting our movies. Is there a specific algorithm you use for motion correction or is that built into your analysis code.
There isn’t anything in here, I played around with it (basically just shifting images around), but from my experience the biggest issue are distortions of the image, which need other forms of corrections. I think I might play around with that at some time, but currently we have a pretty solid prep and there isn’t much movement, even when awake.
We do not use a lot magnification though, so it might vary.
Did you look at the stuff Jason Kerr/David Greenberg did in 2008 (I think Dombeck’s people have some stuff for sure as well).
http://www.ncbi.nlm.nih.gov/pubmed/18789968
A lot of groups have success with the TurboReg plugin in Fiji (ImageJ). Find a portion of the movie with fairly little movement, average those frames together, and then use it as the reference for aligning the full movie. It’s an easy place to start. If that works, even if you think it’s clumsy, at least you have a starting idea of what algorithm can work on your data. For example, perhaps a rigid body transform is sufficient, or it’s not and you need some sort of warping as stephan indicates.. or even perhaps a more powerful approach such as scale-invariant feature transform (SIFT).
I use TurboReg some times, but what i often see is a contentious drift of the images towards one direction after alignment. I might need to play with the settings, though, or look into something else. I will keep it in mind to add that.
I will look into the SIFT, sounds like a nice way.
this one does a decent job if the if the parameters are set up correctly.
http://www.losonczylab.org/sima/1.3/tutorial.html#motion-correction
You could try also moco, from Yuste’s lab (http://www.columbia.edu/cu/biology/faculty/yuste/methods.html). We are playing with it in the lab last days and it looks like it works better than TurboReg (at the very least its many times faster). It seems to work for our purposes.
There were a few files that were needed but not included in the list. Fixed that, so it should work fine now.