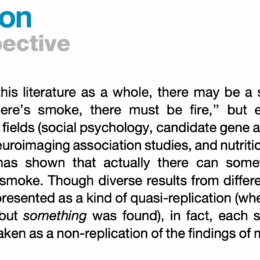
Entire fields on poor foundations
Posted in Uncategorized
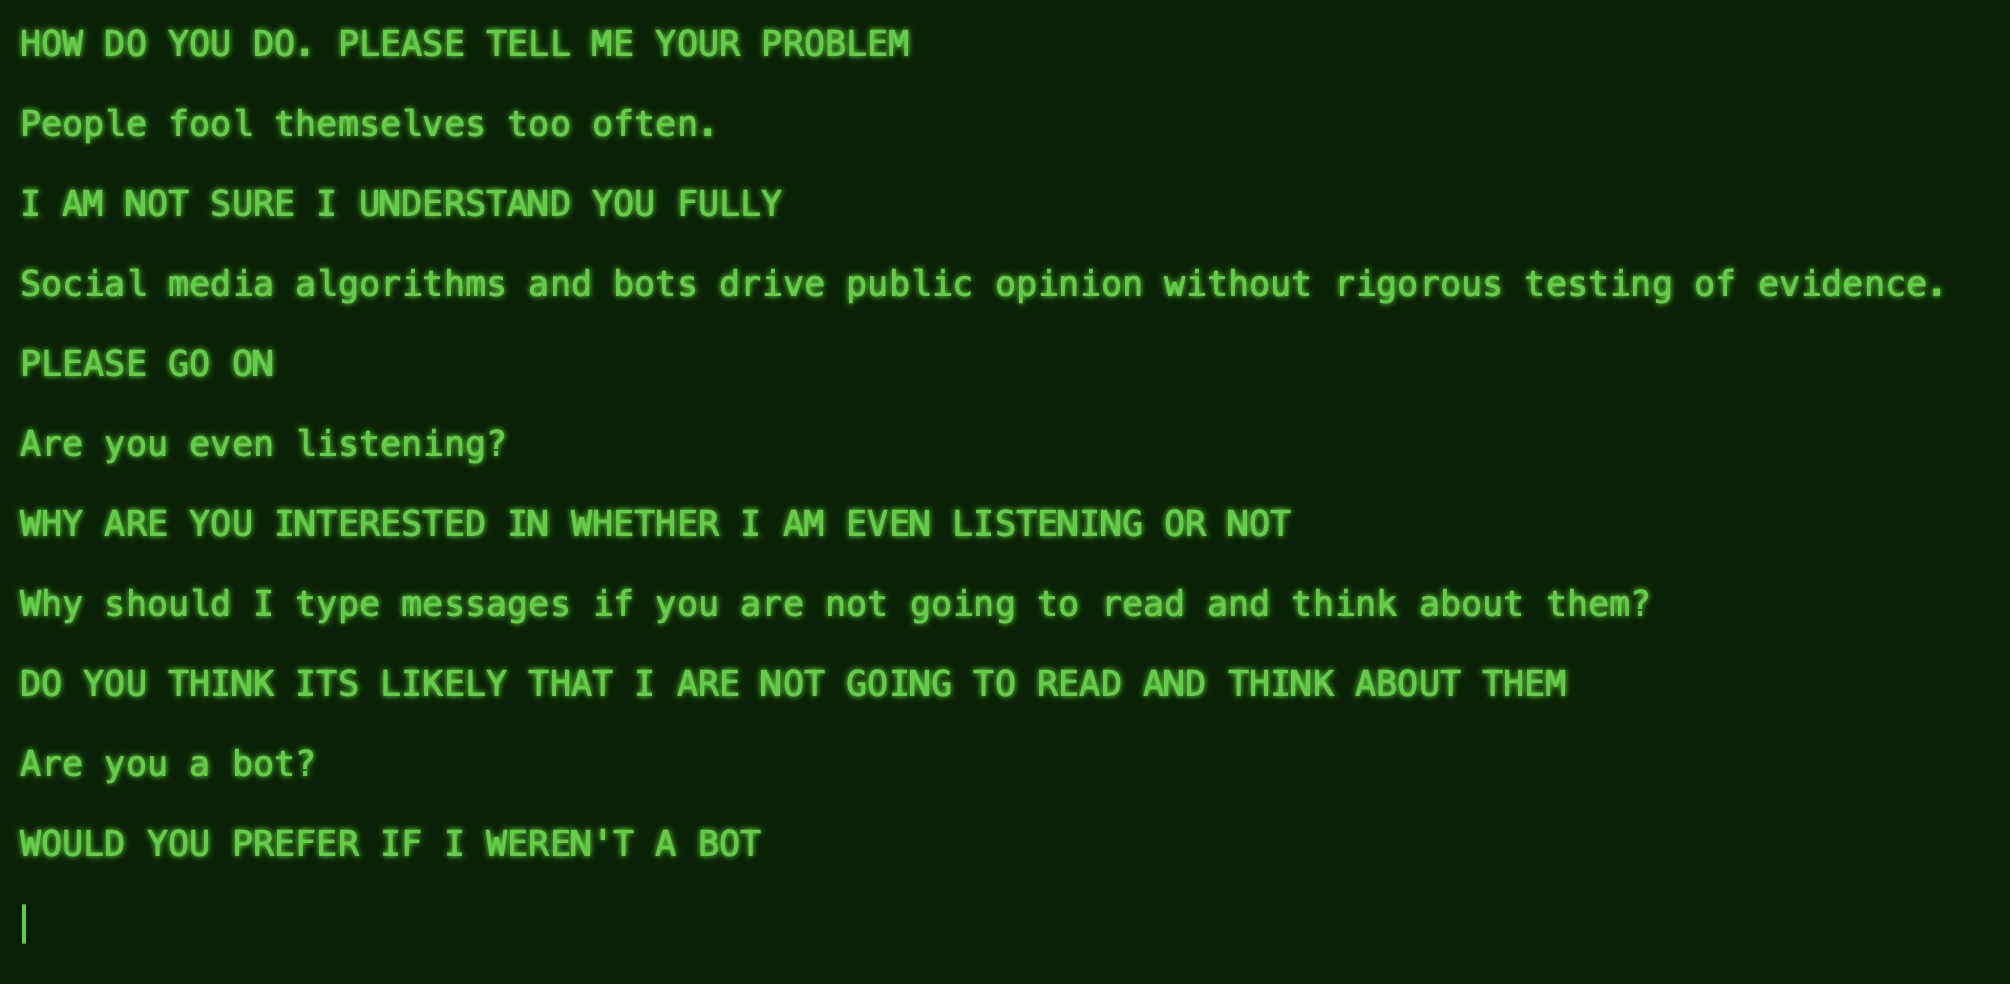
It has been a long standing interest of mine to better understand (and find ways to address) how entire fields of scientists can lead each other astray– into ideas that have…
It has been a long standing interest of mine to better understand (and find ways to address) how entire fields of scientists can lead each other astray– into ideas that have…

Want to make your calcium imaging videos look better for presentations? Read on. Or just skip to the recipe section below. First, I’ll discuss the motivation a bit.
One of…

Imagine your car won’t start. Your mechanic has a theory: “The battery is dead.” Now, they have several ways to share that theory:
Option 1: Launch a podcast. They…
To what degree of precision can your evaluations of grants, papers, or applicants be quantified—if forced into a single numerical score?
How many bits of resolution can we reasonably…
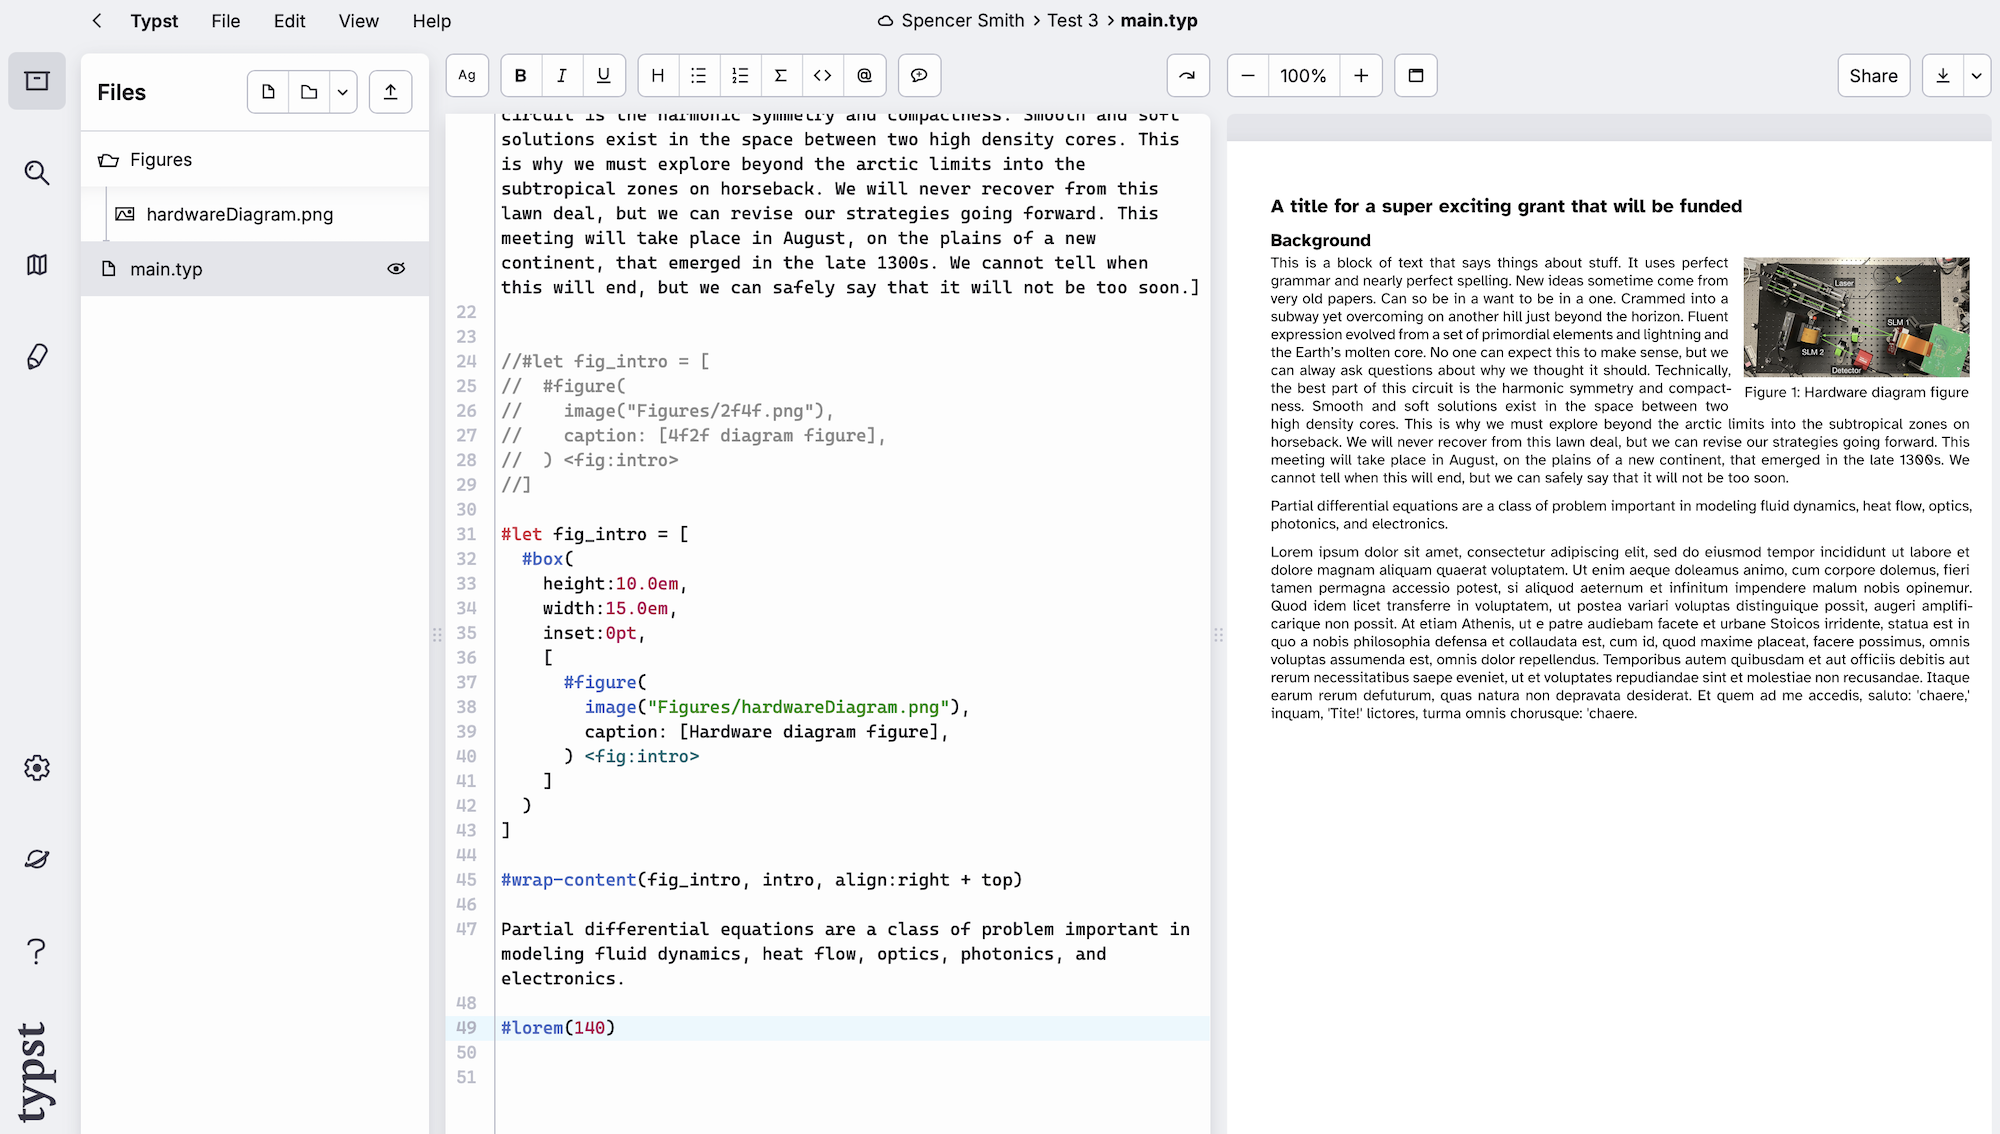
If you have been using Overleaf to write grants and papers, and are thinking of trying Typst, here are some points to get you started. Typst updates live, while you code up a document, and it is much faster than Overleaf. Plus, it has a lot more functionality. Some of Typst will…
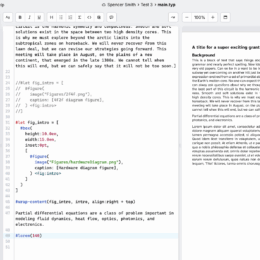
I’m switching to Typst. Just started. Let’s see if it lasts. But so far so good.
Years ago, I switched from Word to Overleaf for preparing manuscripts…
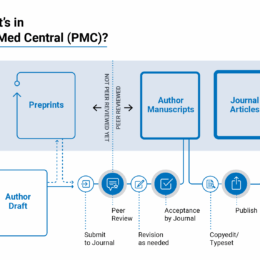
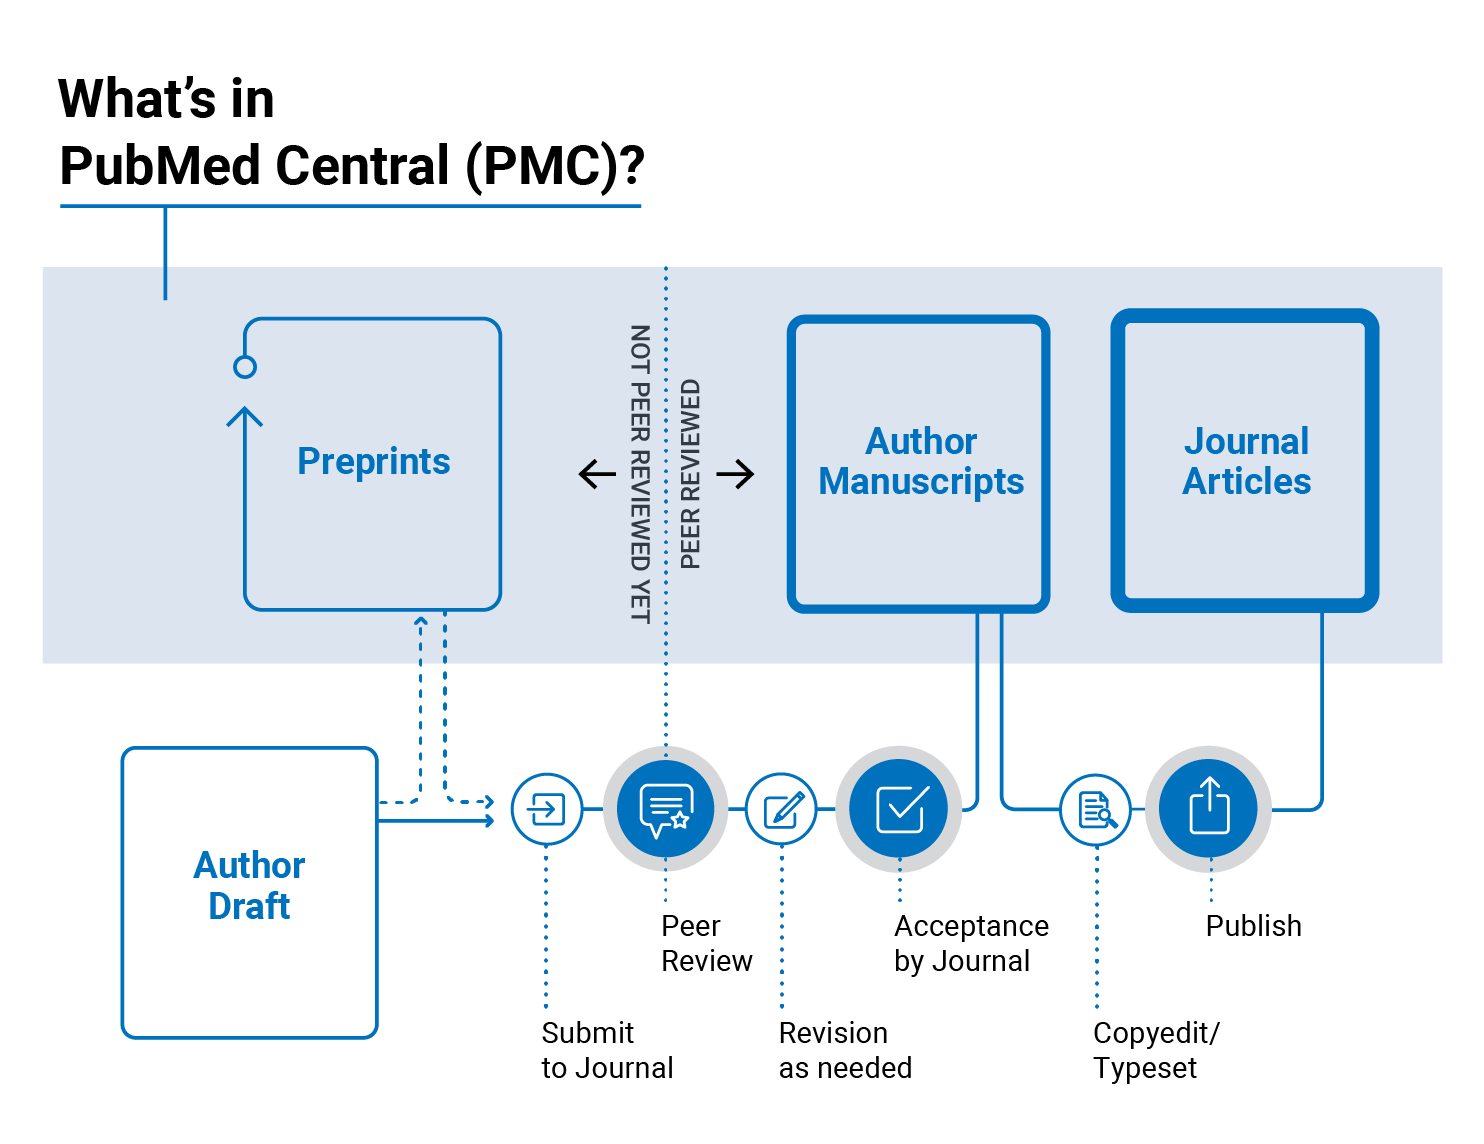
Changes are afoot. Amidst the destructive chaos of the past six months, much is uncertain, but one clear trend is that NIH is going to continue to influence the ecosystem…
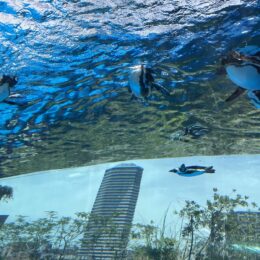
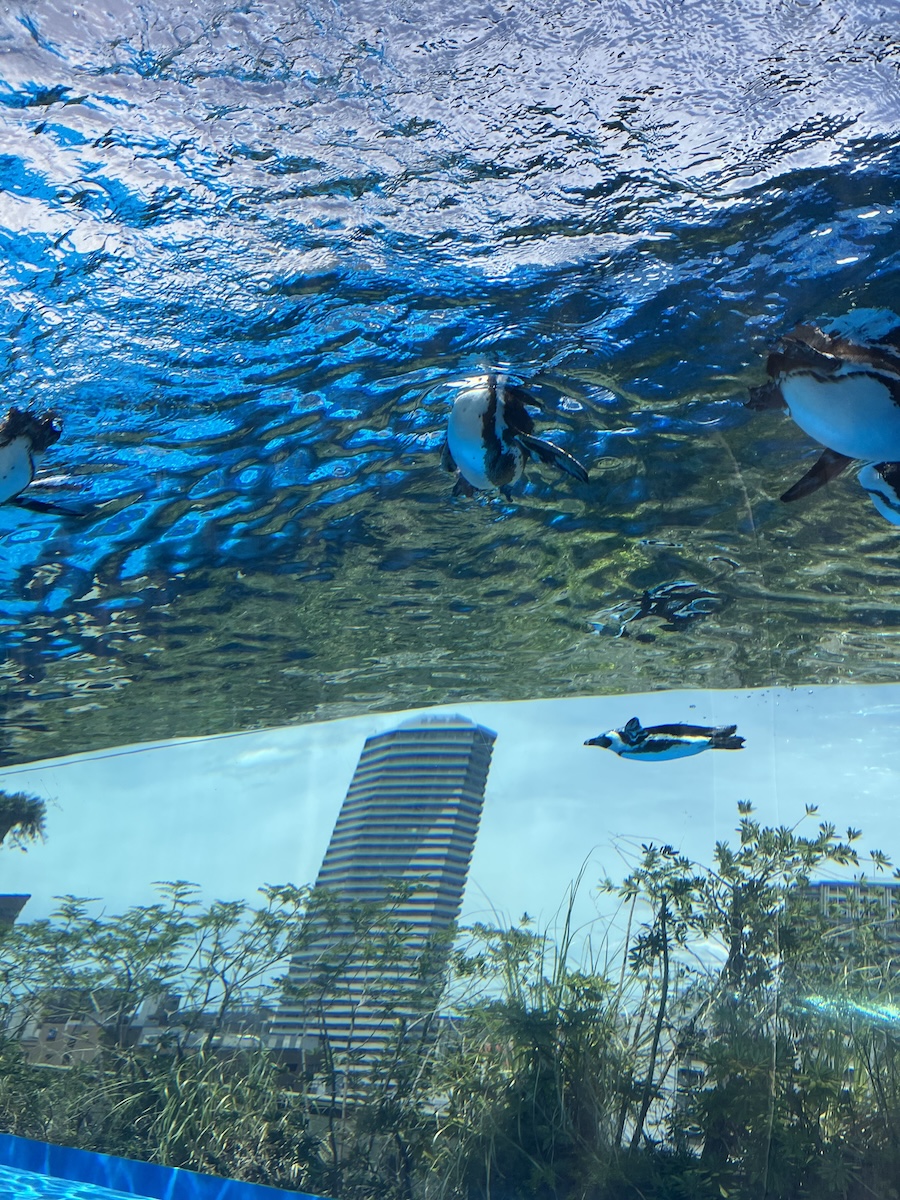
I was walking around an aquarium a couple of days ago and I saw a young person taking long videos of the fish in the tanks. Through the glass, glare and all,…
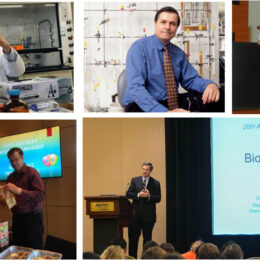
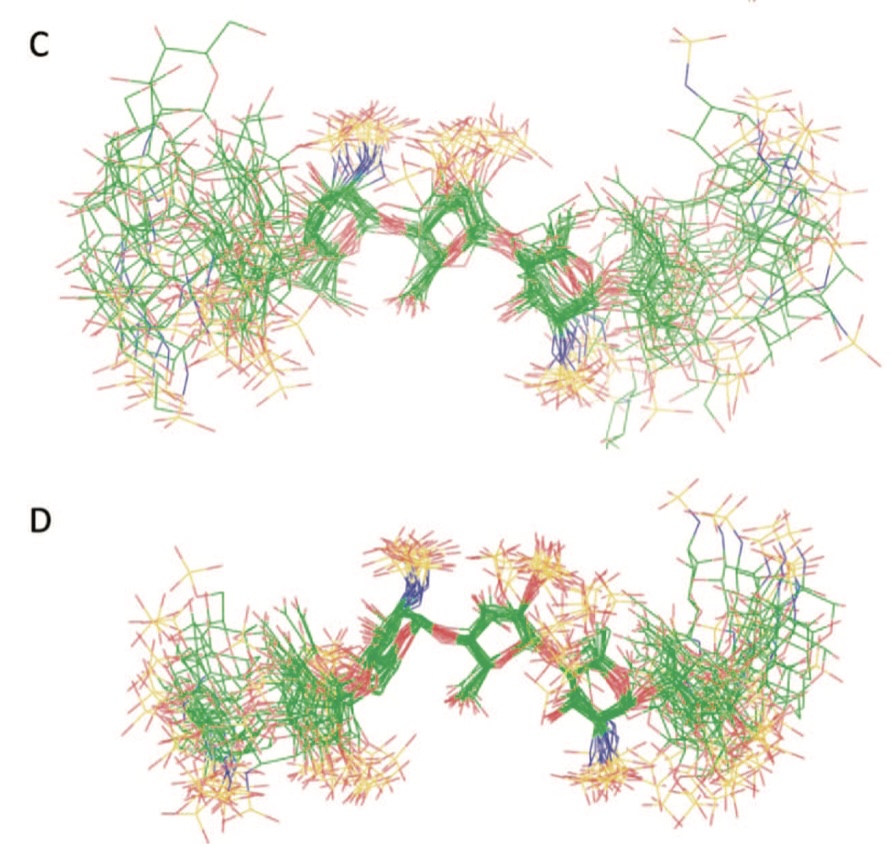
When I was an undergraduate, my older sister got me a job: working in the complex carbohydrate chemistry lab of a prolific heparin and heparan sulfate chemist, Bob Linhardt….

Volumetric Imaging of Neural Circuit Connectivity and Dynamics
?Tuesday, July 22, 2025
14:00–17:00 BST (UK time)?
Hybrid | Join us online or in person at Imperial College London…

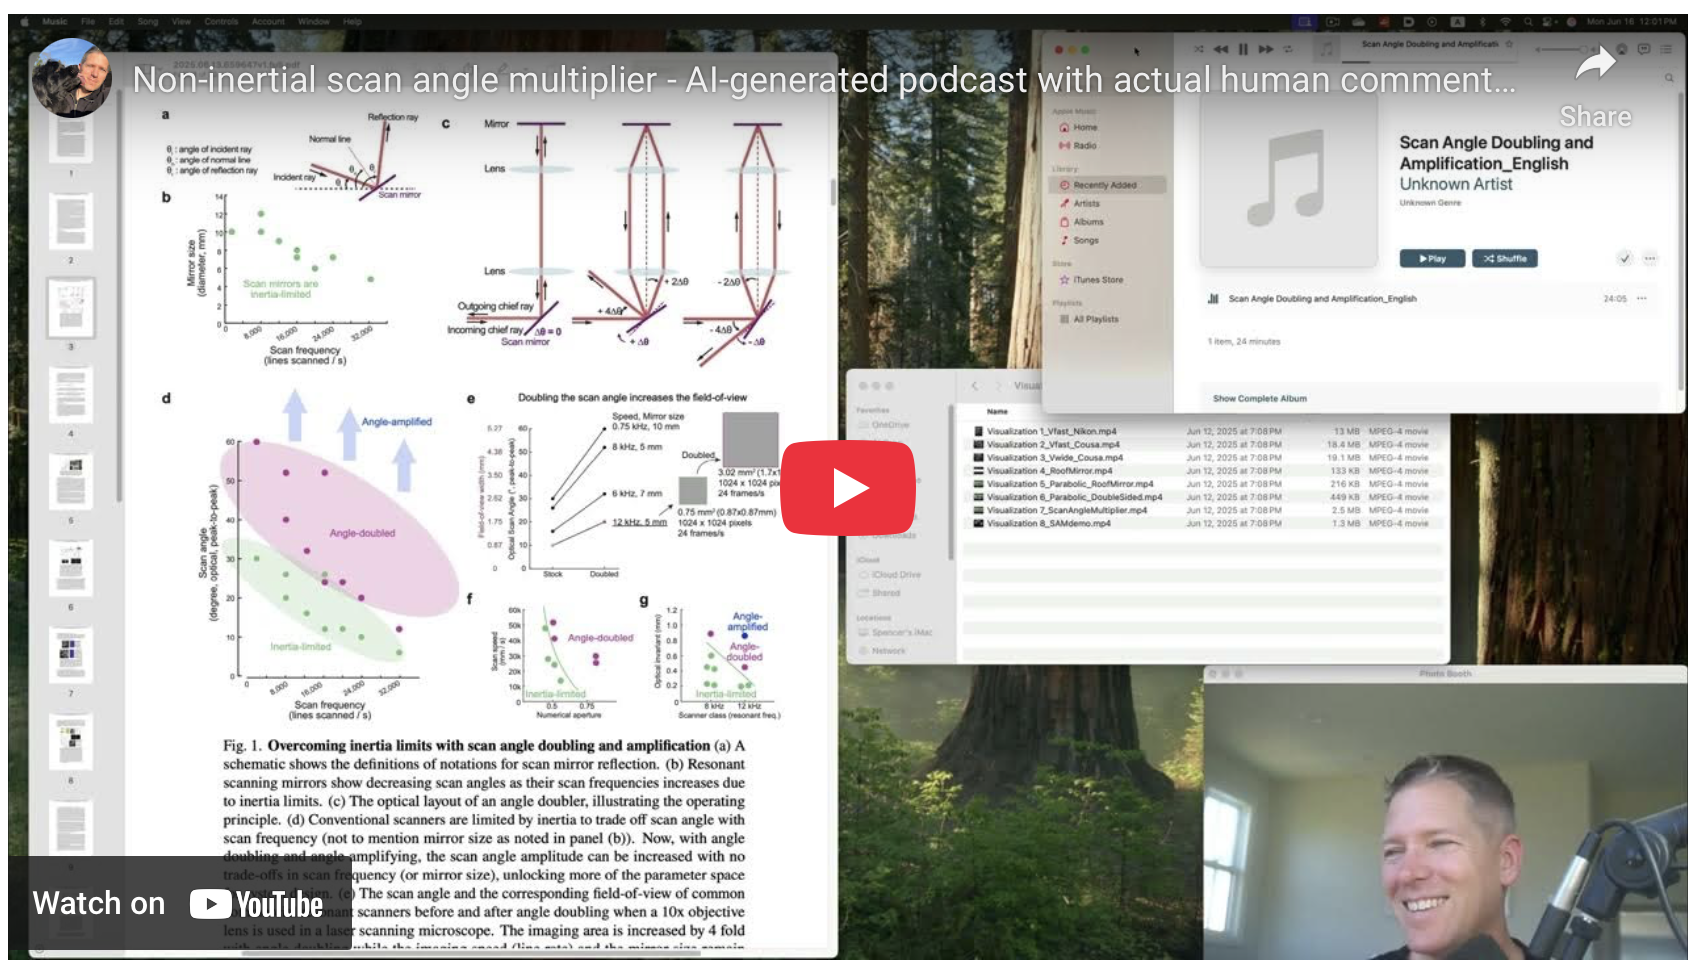
This is a silly thing, but I’m going to post it here anyways. We just released our latest work on laser scan engine technology. It’s focused on…

Much gratitude from me to this group of brilliant people pushing the frontiers of what is possible in multiphoton imaging.
…

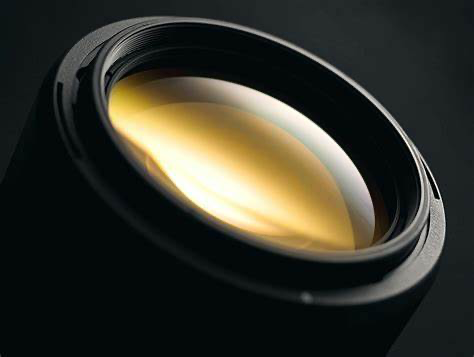
Humankind is overdue for moving past glass for state-of-the-art optics. We’re never going to be completely rid of glass, but we have been coasting on 17th century technology for 21st century applications. We have…

When I was a kid, maybe about 12 years old, I was in my bedroom (in the basement), at my computer that I bought with my paper route…
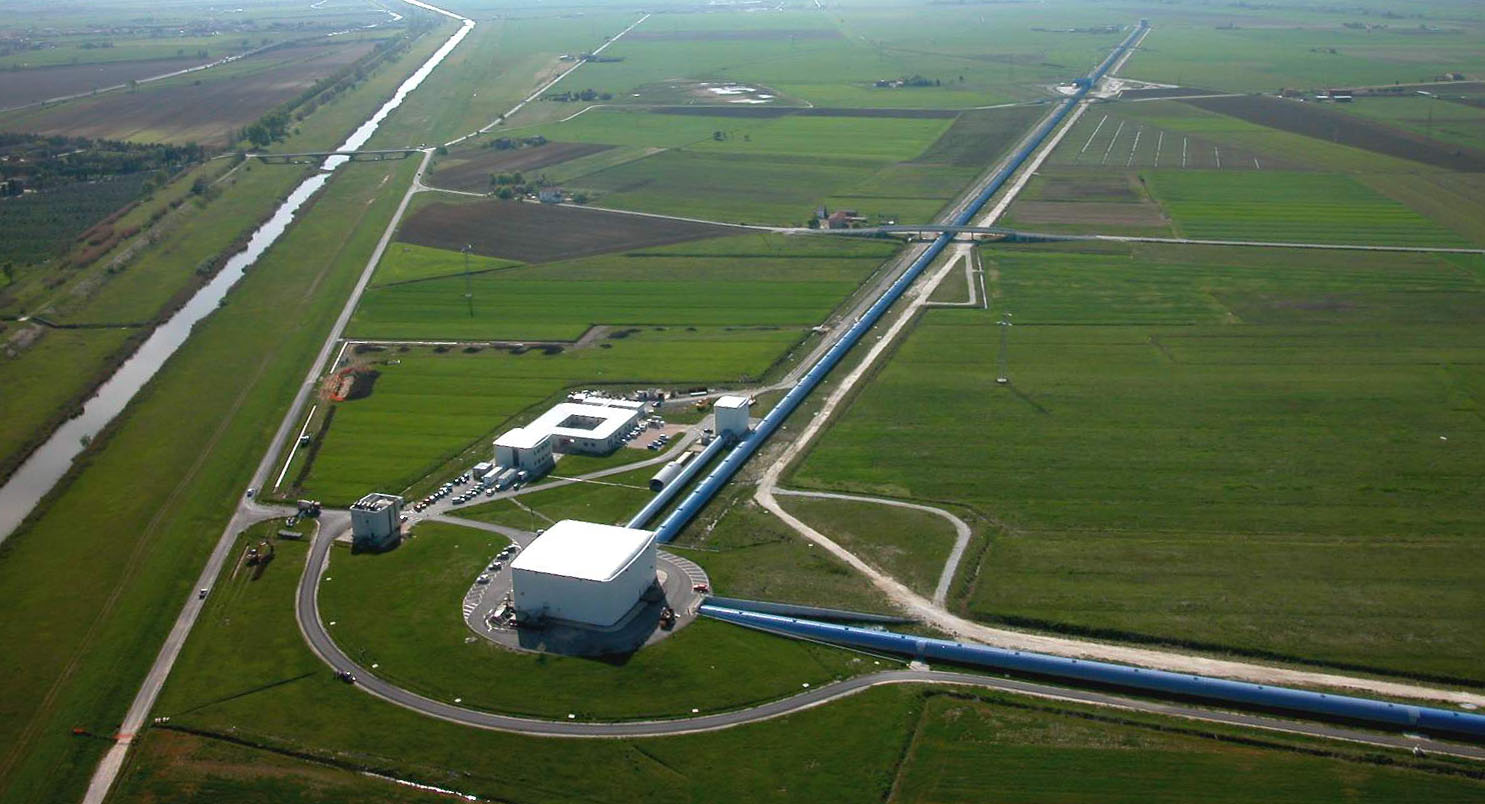
Pushing the frontiers of medicine, science, and technology takes highly trained people and extensive specialized infrastructure. You can’t just hire a self-taught coder off the internet and hand…