Local cross corr images
One key step in analyzing data form calcium imaging experiments is segmentation (i.e., drawing regions of interest, ROIs). There have been some nice discussions in the literature (1, 2, 3, 4). Experiments with calcium dyes like OGB-1-AM, and those with genetically encoded indicators like GCaMP, require different approaches for drawing ROIs.
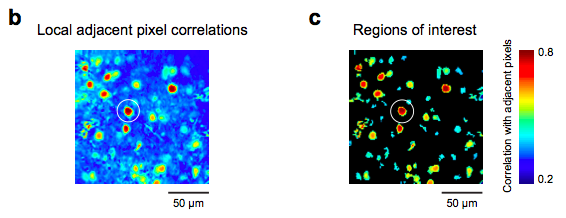
Here’s some code I’ve used to generate a first pass of ROIs. The simple idea is that the pixels that are located within cells will be highly correlated because during a fluorescence transient they will all exhibit similar time courses, and other regions (e.g., neuropil, blood vessels, etc.) will not be as correlated.
The input is an X x Y x T 3D matrix (time or frame is the third dim). The output is an X x Y cross corr image. As written below, it looks at the 3 x 3 local neighborhood. If you increase the variable w to 2, then it will look at a 5 x 5 local neighborhood, and so forth.
function [ccimage]=CrossCorrImage(tc)

w=1; % window size

% Initialize and set up parameters
ymax=size(tc,1);
xmax=size(tc,2);
numFrames=size(tc,3);
ccimage=zeros(ymax,xmax);

tic
for y=1+w:ymax-w
    for x=1+w:xmax-w
        % Center pixel
        thing1 = reshape(tc(y,x,:)-mean(tc(y,x,:),3),[1 1 numFrames]); % Extract center pixel's time course and subtract its mean
        ad_a   = sum(thing1.*thing1,3);    % Auto corr, for normalization later

        % Neighborhood
        a = tc(y-w:y+w,x-w:x+w,:);         % Extract the neighborhood
        b = mean(tc(y-w:y+w,x-w:x+w,:),3); % Get its mean
        thing2 = bsxfun(@minus,a,b);       % Subtract its mean
        ad_b = sum(thing2.*thing2,3);      % Auto corr, for normalization later

        % Cross corr
        ccs = sum(bsxfun(@times,thing1,thing2),3)./sqrt(bsxfun(@times,ad_a,ad_b)); % Cross corr with normalization
        ccs((numel(ccs)+1)/2) = [];        % Delete the middle point
        ccimage(y,x) = mean(ccs(:));       % Get the mean cross corr of the local neighborhood
    end
end
toc
I then use an adaptive threshold algorithm and the MATLAB function “bwlabel” to get a quick, first pass set of ROIs. Once you have your ROIs, you can select weights for the pixels within the ROI, if need be.
Nice idea! But wouldn’t it tend to bias to active cells, ignoring labelled but quiet neurons? This might be desirable under some circumstances, but maybe not all…
True. If you want an estimate of the number or fraction of inactive cells, another, or additional, analysis should be used.
This type of analysis is designed to find active regions.
More problematic is when adjacent cells overlap and they may have correlated activity… but sure, temporal information can help. Not sure correlation is the best measure… Incidentally, you should use nlfilter()…
I check the ROIs by hand. PCA does a good job of dividing ROIs of overlapping cells. With my data, the corrs within cell boundaries are much higher than corrs among cells, so this hasn’t been a problem. However, I can imagine this condition might be a special case for fast imaging, and data from slow scan rates might suffer from the problem you describe.
Thanks for the tip about nlfilter.
And also, check out the ICA-based approaches people have used in the cerebellum in the references I listed above.
[…] mean fluorescence image: the correlation image, standard deviation over the mean, and kurtosis. The correlation image, discussed earlier on Labrigger, shows how correlated a single pixel is with its neighbour. When adjacent pixels are strongly […]
[…] panel. This puts Scanbox into segmentation mode. The first thing it will do is to show the correlation map image in as varying intensity in the red channel. This image corresponds to the average temporal […]
[…] way to average the stack before segmentation is based on this Labrigger post, so somewhat it goes back to the […]
The last link takes me to (Steyn & Pretorius, 1991) on starches – is that what you intended, for weighted pixels? https://www.ncbi.nlm.nih.gov/pubmed/2055483
Strange. Thanks for pointing this out. The link seems to be working for me as is. However, the very first time I clicked it, it did take me to Steyn & Pretorius 1991. So I think I saw what you did, but it only happened once for me. Maybe it was a glitch in the pubmed database.
Strange indeed! And it’s still taking me to (S&P, 1991) today. The Pubmed page shows PMID:2055483 for that publication. Could you perhaps comment here with the PMID for the publication you intend us to read? Thanks.
link “4” should go to:
https://www.ncbi.nlm.nih.gov/pubmed/20711183
And it works for me again today.
However, this post and its references are > 4 years old now. There are more up-to-date conversations about this. I suggest these links:
http://labrigger.com/blog/2016/01/30/constrained-non-negative-matrix-factorization-for-calcium-imaging-data-analysis/
https://www.ncbi.nlm.nih.gov/pubmed/26774160
https://www.ncbi.nlm.nih.gov/pubmed/27571195
https://www.ncbi.nlm.nih.gov/pubmed/27151639
https://www.biorxiv.org/content/early/2017/07/20/061507
https://www.biorxiv.org/content/early/2017/06/27/156786
https://www.biorxiv.org/content/early/2017/08/19/177956
And there are a bunch of other papers on this topic as well. I’m sorry I can’t include everyone’s work here. But this is a decent place to start reading more about the latest work.