Ripple noise on PMTs in 2-photon imaging – Part 2
Posted in Tips
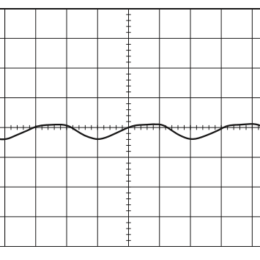
The recent post on ripple noise generated some comments and additional discussion. Go check out the comments on that post. For example, Peter Rupprecht shared some snapshots an oscilloscope display showing the signal from the…