FocusStack and StimServer for MATLAB
Posted in Software
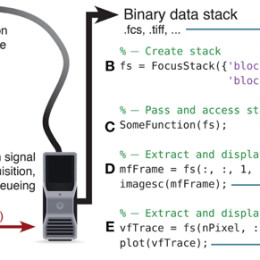
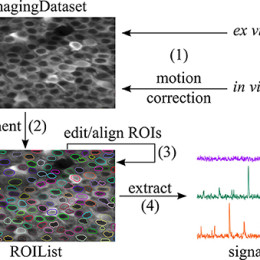
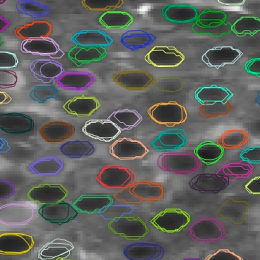
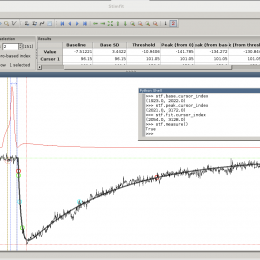
Dylan Muir and Bjorn Kampa created some MATLAB code for two-photon calcium imaging experiments. First up is FocusStack, which provides a suite of analysis tools. Next up is StimServer, which coordinates visual stimulus generation and presentation. …

